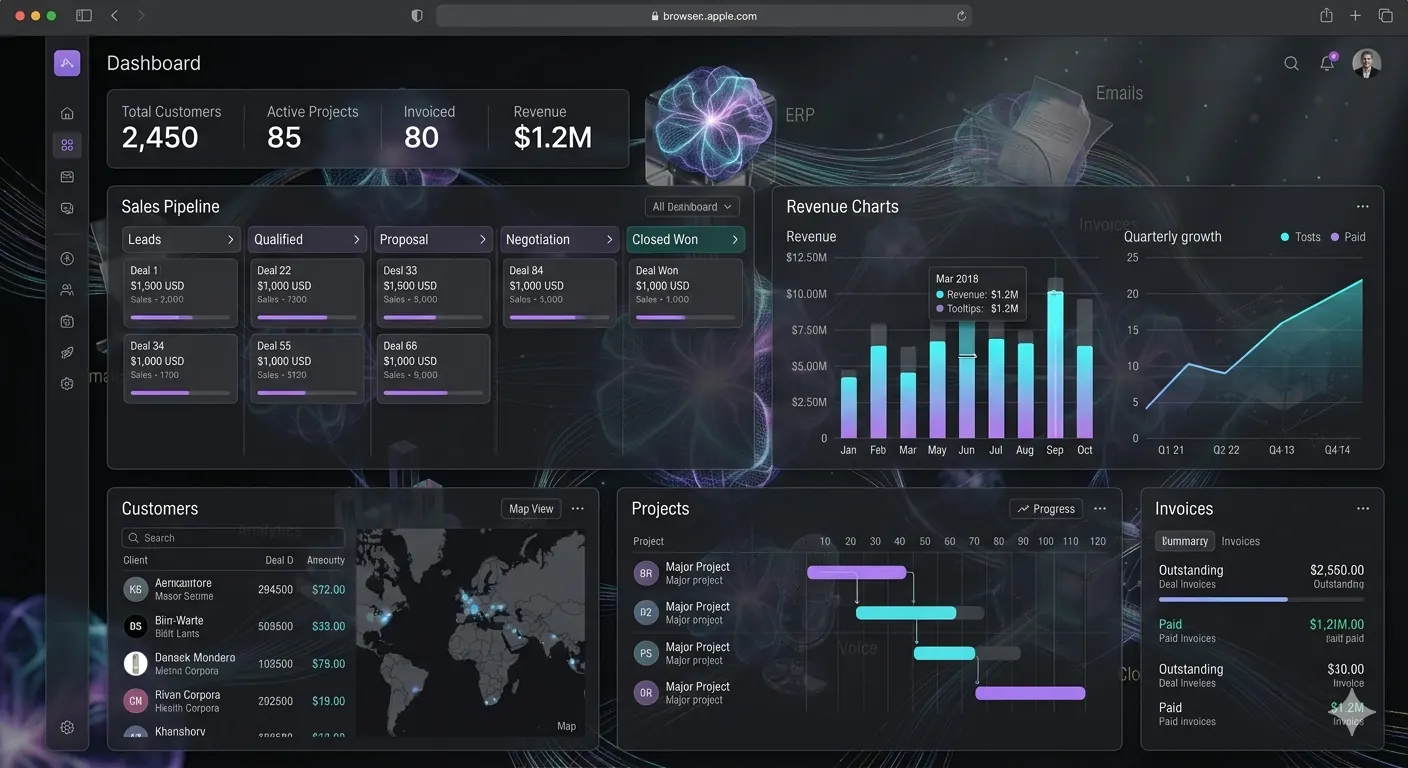
An AI analytics dashboard built for engineers — token counts, embedding latency, prompt version diffs — will not survive the first executive review. Leaders open dashboards when they answer decisions already on the calendar: Are we saving labor? Is quality holding? Where is risk accumulating? If the first screen shows GPU utilization, adoption dies quietly.
QuantaloomAI designs analytics layers for operators and executives simultaneously. Engineers need traces, eval scores, and cost breakdowns. Executives need outcome trends, exception queues, and ROI narratives tied to workflows they recognize from board conversations — not from ML papers.
The gap is rarely tooling. It is metric selection and narrative structure. Dashboards that executives actually use start with three questions: What did the AI do for the business this week? What failed and who owns the fix? What should we fund or kill next quarter?
Why most AI analytics dashboards go unread
Executives do not lack data. They lack decision-ready views. When AI pilots report "10,000 prompts served" without connecting prompts to revenue, cost, or risk, leadership correctly concludes the program is activity without impact.
Failure patterns we see repeatedly:
- Model-first metrics dominate while business KPIs are absent or buried three clicks deep
- Averages hide catastrophes — 92% automation rate masking failures on enterprise accounts
- Stale data without freshness labels erodes trust after one bad planning meeting
- No owner for each metric — dashboards become orphan reports updated inconsistently
Fixing this is not a BI license upgrade. It is product design for decision-makers.
Metrics executives care about — and engineers should still log
Lead with business-facing KPIs mapped to AI workflows. For a hiring platform, show time-to-screen, offer acceptance lift, and recruiter hours reclaimed — not classifier F1. For clinical systems like HMIS Pro, surface documentation completeness, coding accuracy trends, and escalation rates to human reviewers — metrics compliance and ops leaders already track.
Layer technical diagnostics behind drill-downs. Executives should click from "escalations up 12%" to "retrieval missed policy addendum v3" without filing a ticket. This requires data engineering that joins product events, model logs, and business systems into one semantic layer — not three tabs in three tools.
Cost belongs on the executive view, expressed as cost per successful outcome, not cost per API call. A cheap model that doubles rework is expensive. A premium model that eliminates manual review on 40% of cases may be the best investment on the page.
The metric stack we recommend
- Outcome layer: hours saved, cycle time, revenue influenced, errors prevented
- Quality layer: escalation rate, override rate, segment-level completion
- Efficiency layer: cost per outcome, P95 latency for user-facing actions
- Diagnostic layer: retrieval misses, tool failures, policy violations — for engineers only, linked from exceptions
Design principles for dashboards leaders trust
Use familiar time horizons: weekly trend, quarter-to-date, comparison to pre-AI baseline. Executives think in fiscal periods; daily token spikes are noise unless tied to an incident.
Show distributions, not vanity averages. Percentiles, segment breakdowns, and exception tables build trust — especially when AI touches revenue, compliance, or patient care.
Attribute uncertainty visibly. When a metric depends on model-estimated classification, label it. When data is incomplete because an integration lagged, say so. Dashboards that hide freshness erode trust faster than a bad week of numbers.
Limit to one primary action per view. An executive landing page might offer: review top exceptions, approve budget reallocation, or greenlight phase two. Every additional widget competes with the decision you need them to make.
Architecture: from raw logs to executive narrative
Production analytics stacks have four layers: event capture (product and agent actions), enrichment (join CRM, ERP, HRIS context), aggregation (warehouse or lakehouse metrics), and presentation (BI or custom executive views). Skipping enrichment produces charts nobody recognizes.
Define metric ownership early. Product owns completion rate; ops owns escalation SLA; finance owns cost per outcome; security owns policy violation counts. Without owners, dashboards decay.
QuantaloomAI ships analytics alongside SaaS platforms and AI layers so admin consoles and executive summaries pull from the same definitions — no competing numbers in Slack.
Cadence, rituals, and adoption that stick
Dashboards become habits through rituals. A 20-minute weekly AI ops review — exceptions, regressions, wins — beats a quarterly deck that re-explains architecture. Executives adopt tools they see referenced in decisions they already make.
Pair quantitative views with qualitative samples. Three anonymized failure traces often convince faster than a dozen charts. Leaders need stories that connect metrics to customer or employee experience.
Iterate the executive layer based on what gets clicked. If nobody opens the model latency panel, demote it. If exception queues spike engagement, promote filters and owner assignments. Analytics products deserve product management — especially when AI behavior shifts weekly.
When you are ready to build or refactor an AI analytics layer, start from the board question, not the log schema. QuantaloomAI helps teams design AI analytics dashboards executives actually use — grounded in real workflows, honest about uncertainty, and wired to the same pipelines engineers use to ship fixes.
*Written by Sharjeel Ahmed, QuantaloomAI. Book a briefing to design executive analytics for your AI programs.*